Showing posts with label Percent Complete. Show all posts

Monday, August 28, 2017

Breve Introdução ao EVM

A chave para abrir a porta a uma infinidade de métricas de status do projeto é o Valor Ganho (EVM). Esta é uma maneira de colocar um valor no progresso do trabalho alcançado. Mas como é obtido/ganho o valor especificado?
Muito na gestão do valor ganho (EVM) depende do valor monetizado que você coloca em trabalhos realizados ou no progresso em entregáveis.
Vamos apresentar brevemente o valor ganho para suportar o EVM mais simples.

Gestão do Valor Ganho

A EVM é uma maneira de quantificar o progresso do projeto com comparação do progresso real com o progresso planeado e o custo real gasto. A EVM desloca estrategicamente o ponto de vista de planeado versus real (acompanhamento tradicional usado em organizações não-EVM) para planeado versus ganho versus real.

Valor Planeado

A maioria dos projetos vem com orçamentos. Portanto, mudar a perspetiva dos entregáveis planeados, o valor planeado não é um salto particularmente difícil de fazer. O valor planeado é o orçamento ou o custo acordado do projeto e como ele será gasto ao longo do tempo.
Um conceito fundamental no EVM é que o trabalho vale o valor planeado (orçamento) do trabalho. O valor planeado simplesmente indicado é quanto valor você planeou ganhar num determinado momento. Por exemplo, você planeou gastar 6000 € para instalar um gerador diesel num barco. O valor planeado é, portanto, de 6000 €. Por definição, quando esse trabalho estiver 100% concluído, valerá 6000 € para o projeto.

Valor Ganho

O valor ganho mede o progresso entregue em termos monetários (valor do trabalho realizado), e isso permite que o gestor do projeto quantifique o progresso como um valor monetário. Qual a utilidade disto? Uma vez que pode colocar um valor monetário no progresso alcançado, pode compará-lo com o valor planeado e o custo real. Esta mudança de perspetiva de percentagem de conclusão para o valor do trabalho realizado ou do valor ganho é uma mudança no pensamento que contribui significativamente para a análise EVM.
O valor ganho é uma forma de colocar um valor monetário no progresso do trabalho alcançado. A métrica de valor ganho é fundamentalmente um valor total percentual em euros. Em vez de dizer que uma entrega foi completada numa data especificada, o valor ganho diz um valor em termos de um montante em euros do projeto concluído numa data especificada. O valor ganho indicado simplesmente é quanto valor foi ganho efetivamemnte no projeto num determinado momento.
De novo, é uma mudança no pensamento para medir o progresso entregável em termos monetários (valor do trabalho realizado). Isso permite-nos traçar e comparar as três métricas (valor planeado, valor ganho e custo real) num único gráfico, o que, novamente, abre a porta para a análise que de outra forma, não é possível. Assim, pela medida do progresso entregável em termos monetários (valor do trabalho realizado), é possível projetar ou sobrepor o progresso do trabalho no mesmo gráfico que o custo orçamentado e o custo real, o que aumenta significativamente a possibilidade de métricas disponíveis.

Gráfico de Custo

Vamos em primeiro lugar decifrar a situação de agendamento a partir de um gráfico de custo e, em seguida, adicionar o valor ganho para mostrar como a adição do valor ganho proporciona uma melhor compreensão da situação verdadeira do plano. Na Figura 1, temos um gráfico de orçamentado versus  custo real ao longo do tempo ou plano de despesa versus de fundos gastos.

Figura 1
O custo orçamentado é o valor planeado do trabalho do projeto. Novamente, pense em termos de valor ou em termos económicos. Este gráfico mostra que os custos reais do projeto são significativamente menores do que os custos orçamentados. Parece que tudo está bem com o projeto - parecemos estar subestimando. Mas o que essa trama nos informa sobre o trabalho real concluído? Não muito; A percentagem do orçamento gasto ou o custo real não equivalem à percentagem do projeto completo. "A percentagem do gasto não é percentagem do feito". Então, ainda estamos no escuro em relação à situação de status.

Gráfico de Custo e de Valor Ganho

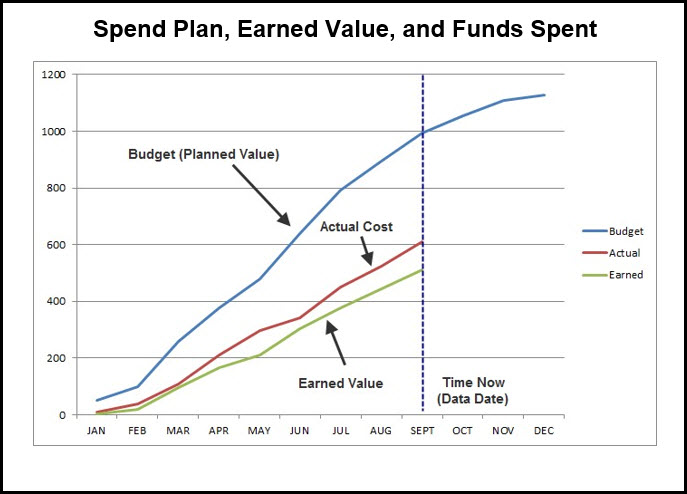
Agora vamos adicionar o valor ganho a essa trama para obter mais informação; o valor ganho contabiliza quer o custo do projeto como a situação de trabalho alcançada para colocar o valor no trabalho realizado. Este custo do projeto e a medição de progresso entregável em termos de euros fornece a valiosa terceira etapa, figura 2, para os lotes de custo orçamentado e custo real.
Figura 2
Quando adicionamos uma percentagem de conclusão em euros ou valor ganho para a nossa trama, observamos que a situação do cronograma real não é boa. O valor obtido a partir de setembro é significativamente menor que o custo orçamentado, então estamos atrasados. E o valor ganho a partir de setembro é menor do que o custo real, então nossa taxa de uso dos fundos do projeto é maior do que a taxa de progressão entregável; Estamos sobre o orçamento no trabalho concluído. O lote de valor gano revelou a verdadeira situação do    projeto, o que não é bom.
O gráfico de exercício mostra o valor em traçar a métrica de valor ganho e os custos em conjunto. Fornece uma visão de cronograma muito melhor e permite que uma análise que de outra forma não seria possível. A intenção aqui não é listar as muitas métricas de medição de valor ganho que ficam disponíveis a partir deste gráfico de três elementos. Essas métricas de gestão do valor ganho estão resumidas no Cartão de Ouro de Gestão de Valor Ganho da Defense Acquisition University.
Por enquanto queremos somente apreciar melhor o valor obtido ao discutir um projeto. No projeto de demonstração, acordou um contrato para construir 4 Quilómetros de via férrea por 400 mil em quatro meses com um contratado. No final de 3 meses, o contratado completou apenas 2 milhas de via com um custo de US $. ~
O gráfico apenas considera os custos orçamentados e reais, então dirá que no final de três meses você está 50.000 € acima do orçamento. Você gastou 350.000 quando foi orçado para gastar apenas 300.000. Mas esta análise apenas considera custos planeados e custos reais. O valor do trabalho alcançado não é considerado. O valor ganho considera o custo e o âmbito do trabalho alcançado em conjunto.
A análise do valor ganho diz que, a cada mês, devem "ganhar" 100 mil se estiverem no alvo por custo e cronograma. Infelizmente, em 3 meses eles apenas completaram 2 milhas de trilhos, pelo que seu valor ganho é de apenas 200.000. Bem, eles gastaram 350.000, então eles estão acima do orçamento em 150.000 e não 50.000. Também só completaram 2 milhas de trilho quando o programado para completar era 3 milhas, então estão atrasados em 100 mil. Esta análise de cronograma é refletida no gráfico de valor obtido para o projeto ferroviário, Figura 3.
Figura 3
A análise deste gráfico mostra uma variância de custo do valor real de ganhos de 150.000, o que é 3 vezes mais a variação de custo quando apenas considerando valores de custo e valor ganho. O planeado para o valor ganho em Euros é de 100.000. Note que o gráfico também exibe convenientemente o valor de tempo dessa variação de cronograma, 1 mês.

Sumário

Quando se trata de medir o progresso do cronograma, é comum considerar o âmbito completo ou os entregáveis submetidos. Se, no entanto, incluímos tanto o custo quanto o âmbito do trabalho alcançado juntos na medida de progresso chegamos ao termo útil no agendamento de valor ganho.
A métrica do valor ganho, novamente, é fundamentalmente uma percentagem de conclusão em Euros. O valor ganho não é simplesmente o dinheiro gasto; É o valor do euro colocado no âmbito completado. Considere-o como o dinheiro obtido pelo âmbito concluído. O subcontratado conclui o trabalho e é compensado monetariamente em conformidade. Essa compensação correlaciona-se com o valor ganho num momento no tempo durante a vida do projeto.

O projeto é, portanto, compartimentado em pedaços de trabalho que têm valor monetário e, se completo, valor ganho. O valor ganho, além do plano de gastos (orçamento) e dos recursos gastos, fornece muita visão sobre a verdadeira situação do projeto.

Sunday, August 27, 2017

Brief Introduction to Earned Value

The key to unlocking the door to a plethora of project status metrics is earned value, which is a way of placing a value on the progress of work achieved. But how is earned value specified?
Much in Earned Value Management (EVM) hinges on the monetized value you place on accomplished work or progress on deliverables.

This article briefly discusses earned value to support more insightful EVM.

Read The article on Tensix

Monday, April 20, 2015

Measuring Project Progress: 6 Methods You Should Know

By Reshma Sadhu

Accurately measuring the progress of a project is always a challenge. There are many factors to account for in an progress update – type of measurement, accuracy of the data, frequency of the collect and the system of record are all important factor in accurate progress measurements.

And software packages like Primavera P6 don’t always help us out. Sure there a 3 choices for Percent Complete Types, but how to we decide which one works best and under which conditions?

Inaccurate progress will foil your ability to spot early warning signs of trouble ahead, so to avoid that, here are 6 common methods for measuring project progress that will help you best measure performance and work completion. The methods below are summarized from “Project Control: Integrating Cost and Schedule in Construction,” by Wayne Del Pico.


1. Units Completed

The Units Completed lends itself well to tracking tasks that are done repeatedly, where each iteration can easily measured. Usually a task that is done repeatedly tends to take about the same amount of time, resources and effort, so tracking the units completed works well here. A simple example could be installing standard light fixtures. Each fixture takes roughly the same amount of time; if we had 100 fixtures to install then we can simply count the units installed. In this case there’s no subjective experience-based judgement involved.


2. Incremental Milestones

Also known as the ‘steps’ method, the incremental milestones method is predominantly used for cost accounts that involve subtasks that need to be completed in an orderly fashion. An example of this technique is the forming and placing of a concrete foundation wall. Laying the foundation wall on footings, erecting inside wall panels and brace, setting horizontal and vertical rebar in formwork and so forth needs to be done in sequence to complete the task appropriately.

So how do you calculate this data? The calculation is built on each single item step and the budgeted amount of time (labor hours) that is needed to complete the task by the construction crew. As each step is completed, that is documented as a mini-milestone which represents a percentage of the total installation process. The percentage given for each subtask can vary based on the project and this progress is usually agreed on to be used as a measuring took beforehand. A good way to implement this method in Primavera P6 is using Activity Steps.


3. Start/Finish

This method is only focused on capturing the starting point and the finishing point of the task and nothing in between. This method is best for tasks that are short in duration. You would implement this method if the task’s work estimations are not available or if the percent complete progress data is too difficult to collect.

“Classic examples include testing services such as load test on electric panels, flushing and cleaning of piping, and similar tasks.”1

Using the Start/Finish technique, we earn a percentage of progress when the task starts and the other half is earned once the task is complete. These percentages are determined by the owner and contractor of the project.

Often, companies agree to use the standard 50/50 Rule or other rules:

50/50 Rule – once started, the task is marked as 50% complete, and the balance is earned at final completion of the work.

20/80 Rule – used to track higher value tasks that takes a longer time to reach completion.

0/100 Rule – this rule illustrates that once 100 percent of the task is completed, only then will the value be earned. An example of this is in testing or experimental tasks since you cannot get results until the task is completed.


4. Cost Ratio

The Cost Ratio method is usually implemented on a project that has tasks that tend occur over a long phase or the entire project. Often used for Overhead costs, this technique is measured based on the budgeted allocation of dollars vs. the labour hours of production. This method gives the contractor the ability to earn value that is equal to the overall percent of project completion.

“For example,[] if the overall progress of the project was determined to be 42 percent, then the contractor would have earned 42 percent of the overhead and fees.”1


5. Experience/Opinion

Unlike the methods above that rely on definitive data, this method is relies on the experience and subjectivity of the project manager. This technique is used for tasks such as dewatering or frost removal/protection. It’s not usually recommended and tends to be seen as the last resort because each individual’s experiences and opinions vary from one another and can cause conflict between owners, contractors and architect.
 

6. Weighted or Equivalent Units

This method was highlighted as the best technique in the text and is the one that requires more effort, but also extends to a wider data range. The tasks that are being calculated tend to occur over a longer duration time and includes multiple subtasks, where subtasks can have different units of measurements.

The example used to illustrate this method is building a structural steel package. In order to complete this project it requires various units, labor hours, resources and subtasks. So to calculate the subtasks, it’s weighted on the estimated level of efforts in labor hours or by monetary value that is particular to each subtask. Once the weighted value is determined, it’s converted to reflect that value in units of measure specific to the task – and for this example, the units of measure would be tons. So once each subtask has been completed, the weighted tons (units of measure) is then converted to the equivalent units of percentage complete of the overall project.

These 6 methods for measuring project progress are commonly used in Construction project management and filter into a process of determining a percentage complete for the project as a whole using Earned Value Management.

Which of these methods do you the most on your projects?

Tuesday, September 2, 2014

Percent Complete Type

The activity percent complete type is one of "Duration", "Units", or "Physical". The percent complete type controls whether the Activity % Complete is tied to the Duration % Complete, the Units % Complete, or the Physical % Complete for the activity. Set the percent complete type to "Duration" for activities which are duration driven, for example, administration tasks and training classes. Set the percent complete type to "Physical" for activities which are work-product driven, for example, creating a document or a product. Set the percent complete type to "Units" for activities which are work effort driven, for example, providing a consulting service.

Activity Percent Complete Fields

Physical % Complete

The activity physical percent complete. The physical percent complete reflects the actual progress made on the activity's work products so far. Physical percent complete can be manually entered by people familiar with the status of the activity's work products or it can be based on the completion of assigned Steps. Always in the range 0 to 100.

Duration % Complete

The percent complete of the activity duration. Computed as ((Planned Duration - Remain Duration) / Planned Duration) * 100. Always in the range 0 to 100. The planned duration is taken from the current plan, not from the current baseline.

Duration % of Planned

The activity actual duration percent of planned. Computed as (Actual Duration / BL Duration) * 100. The value can exceed 100. The BL Duration is the activity's at complete duration from the current baseline.

Activity % Complete

The activity percent complete. This value is tied to the activity Duration % Complete, Units % Complete, or Physical % Complete, depending on the setting for the activity's Percent Complete Type, which is one of "Duration", "Units", or "Physical". Always in the range 0 to 100.

Schedule % Complete

The Schedule % Complete specifies how much of the activity's baseline duration has been completed so far. Computed based on where the current data date falls between the activity' s baseline start and finish dates. If the data date is earlier than the BL Start, the Schedule % Complete is 0. If the data date is later than the BL Finish, the Schedule % Complete is 100. The Schedule % Complete indicates how much of the activity duration should be currently completed, relative to the selected baseline.

Note: Summary Schedule percent complete when displayed on an organize band, will ALWAYS be calculated as (BCWS* 100) / BAC, regardless of what earned value technique i. s selected for the activity's WBS.

Performance % Complete

Performance percent complete is used to compute earned value and may be based on the Activity % Complete, on the 0/100 rule, on the 50/50 rule, etc., depending on the technique for computing earned-value percent complete for the activity's WBS. The Performance % Complete specifies what percentage of the activity's planned worth has been earned so far.

Note: Summary Performance percent complete when displayed on an organize band, will ALWAYS be calculated as (BCWP * 100) / BAC, regardless of what earned value technique is selected for the activity's WBS.

Thursday, August 8, 2013

Primavera P6 Percent Complete Types

by TheP6Pro

When adding activities to a Primavera P6 EPPM or Professional schedule, you have three possible percent complete types to choose from: Duration, Physical and Units. Which one you choose depends on your desired outcome. This article explains each of the Primavera P6 activity percent compete choices, when you should use a particular percent complete type and how they affect your process for entering status to your project’s schedule.

The Activity % Complete Field

Before we get into the specifics of the percent complete types, we need to take a quick look at the Activity % Complete field. This field’s existence can be a little confusing because it sounds like another percent complete type. However it is, in fact, a field (column) into which a value can be placed to update the value in the activity’s selected percent complete type field. In other words you don’t need to add a column for all three percent complete types that you might be using within a schedule, rather you just add the Activity % Complete field, and enter your values there.

Any option that reduces the number of columns you need to have displayed in your P6 table area is a good thing.

Duration % Complete

This option is used to calculate progress from the planned and remaining duration values. For example, if you enter 6 days of remaining duration for a 10 day duration activity, Primavera P6 will calculate 40% complete. Transversely, if you enter 40% in the Activity % Complete field, P6 will calculate a remaining duration of 6 days.

Original or Planned Duration – Remaining Duration = Percent Complete

Usage:

Enter a percent complete value in the Activity % Complete column or directly into the Duration % Complete column. Primavera P6 will automatically calculate the Remaining Duration for the activity. Or enter a Remaining Duration value and let P6 calculate the percentage.

This percent complete type is best used for more level of effort type activities where measurable deliverables are not expected and the percent complete represents elapsed time more than deliverables completed.

Physical % Complete

The percent complete values will be entered by the user manually. Entering a value in the Activity % Complete field will update the Physical % Complete value. The Physical % Complete type is required if you wish to use Steps to drive progress.

Caution: When Physical % Complete is used, you must adjust the Remaining Duration as this is not calculated by Primavera P6. You must enter a Remaining Duration manually, or set an Expected Finish date on the activity.

If you don’t adjust the Remaining Duration, P6 will add the Actual Duration to the Remaining Duration. This will cause unnecessary variance in the project and will likely alter your critical path. As you can see in the following figure, the Remaining Duration remained at 10 days, the Actual Duration was added to it, giving an At Completion Duration of 14 days, and pushing all successor activities out but that amount.

You can use the Expected Finish date option to help control the remaining duration of Physical % Complete activities. Adding a date in the Expected Finish date field locks down the end date of the activity and forces P6 to calculate the Remaining Duration.

In the above image you can see that an Expected Finish date of 27-Jan-15 has pulled the end date back to its original date and caused P6 to calculate a 6 day remaining duration.

Physical % Complete and Steps

An additional advantage when using the Physical % Complete technique is the ability to progress the activity using weighted steps. Weighted Steps are simply a checklist of things that must be completed before the activity can be considered finished.

Continuing with our Mobilize activity example, weighted steps have been added from a Step Template.

The weights values entered will be calculated to a percentage value by Primavera P6 and will drive the Physical % Complete value of the activity. The weight values can be any decimal number and thus spare the user from manually calculating the Percent Complete values; they just enter some arbitrary value based on whatever factor they choose; number of hours, relative degree of difficulty, whatever.

As Steps are checked off as Completed, so they will drive the Percent Complete for the activity. The user will still need to manually update the remaining duration or expected finish date values as previously described.

Note: the “Calculate Activity % Complete from the activity steps” must be set in the “Calculations” tab of the “Set Project Preferences” dialog must be set in order for this feature to work.

Usage:

The Physical % Complete progress type should be used when dealing with discrete work that equates to one or more measurable delivery items.

Units % Complete

The Units % Complete type is used when resources are assigned to an activity and actual units worked will be tracked. Actual Units may be entered manually or via the Apply Actuals feature that loads actual units from a timesheet module such as Primavera Progress Reporter.

As with Physical % Complete, Units % Complete doesn’t calculate the remaining duration for activities, so you will need to use either the Remaining Duration field or an Expected Finish date to manually control the calculated end date for your activity.

Usage:

Use Units % Complete when resources are assigned to the activity and actual units will be tracked. The only drawback of this method is that hours expended doesn’t necessarily equate to progress achieved, so this method is not very discrete.

Summary

I hope this article helps give you a better understanding of each of the Primavera P6 activity percent complete choices, when they should be applied and what the outcome will be when statusing your project.

The original post is on here! On Ten Six Consulting blog.