Showing posts with label Reporting. Show all posts

Thursday, March 8, 2018

10 Reasons Why Construction Schedules Fail and How To Avoid This


This post was originally published on the RepOne blog.
CPM Schedules invariably become erroneous, despite best practices, when the rest of the team isn’t pulling their own weight. The integrity of the schedule may have nothing to do with why it became useless or meaningless, or as I like to say, a recorder more than a predictor of the critical path and progress. If the project is large and has multiple prime contractors, its schedule is all the more susceptible to deprecation.
“A CPM schedule ceases to achieve its intended purpose once it becomes a recorder, rather than a predictor.
Read it on Plan Academy

Thursday, December 14, 2017

Primavera P6 Project Layout Files (PLFs) Explained

In Primavera P6, it can take some effort to achieve an agreeable look and feel for the presentation and/or layout of your schedule activity table and Gantt chart. Did you know these layouts could be saved and used for reporting on other projects as well?

Often the schedule creation process requires carefully setting up the activity’s screen, i.e. activity table and Gantt chart. And special activity layout presentations are essential for reporting project status to stakeholders. 


Read the post on TenSix

Monday, August 28, 2017

Breve Introdução ao EVM

A chave para abrir a porta a uma infinidade de métricas de status do projeto é o Valor Ganho (EVM). Esta é uma maneira de colocar um valor no progresso do trabalho alcançado. Mas como é obtido/ganho o valor especificado?
Muito na gestão do valor ganho (EVM) depende do valor monetizado que você coloca em trabalhos realizados ou no progresso em entregáveis.
Vamos apresentar brevemente o valor ganho para suportar o EVM mais simples.

Gestão do Valor Ganho

A EVM é uma maneira de quantificar o progresso do projeto com comparação do progresso real com o progresso planeado e o custo real gasto. A EVM desloca estrategicamente o ponto de vista de planeado versus real (acompanhamento tradicional usado em organizações não-EVM) para planeado versus ganho versus real.

Valor Planeado

A maioria dos projetos vem com orçamentos. Portanto, mudar a perspetiva dos entregáveis planeados, o valor planeado não é um salto particularmente difícil de fazer. O valor planeado é o orçamento ou o custo acordado do projeto e como ele será gasto ao longo do tempo.
Um conceito fundamental no EVM é que o trabalho vale o valor planeado (orçamento) do trabalho. O valor planeado simplesmente indicado é quanto valor você planeou ganhar num determinado momento. Por exemplo, você planeou gastar 6000 € para instalar um gerador diesel num barco. O valor planeado é, portanto, de 6000 €. Por definição, quando esse trabalho estiver 100% concluído, valerá 6000 € para o projeto.

Valor Ganho

O valor ganho mede o progresso entregue em termos monetários (valor do trabalho realizado), e isso permite que o gestor do projeto quantifique o progresso como um valor monetário. Qual a utilidade disto? Uma vez que pode colocar um valor monetário no progresso alcançado, pode compará-lo com o valor planeado e o custo real. Esta mudança de perspetiva de percentagem de conclusão para o valor do trabalho realizado ou do valor ganho é uma mudança no pensamento que contribui significativamente para a análise EVM.
O valor ganho é uma forma de colocar um valor monetário no progresso do trabalho alcançado. A métrica de valor ganho é fundamentalmente um valor total percentual em euros. Em vez de dizer que uma entrega foi completada numa data especificada, o valor ganho diz um valor em termos de um montante em euros do projeto concluído numa data especificada. O valor ganho indicado simplesmente é quanto valor foi ganho efetivamemnte no projeto num determinado momento.
De novo, é uma mudança no pensamento para medir o progresso entregável em termos monetários (valor do trabalho realizado). Isso permite-nos traçar e comparar as três métricas (valor planeado, valor ganho e custo real) num único gráfico, o que, novamente, abre a porta para a análise que de outra forma, não é possível. Assim, pela medida do progresso entregável em termos monetários (valor do trabalho realizado), é possível projetar ou sobrepor o progresso do trabalho no mesmo gráfico que o custo orçamentado e o custo real, o que aumenta significativamente a possibilidade de métricas disponíveis.

Gráfico de Custo

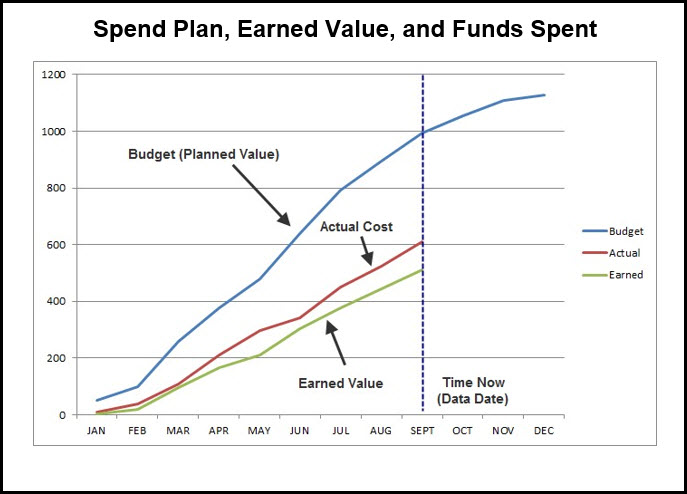
Vamos em primeiro lugar decifrar a situação de agendamento a partir de um gráfico de custo e, em seguida, adicionar o valor ganho para mostrar como a adição do valor ganho proporciona uma melhor compreensão da situação verdadeira do plano. Na Figura 1, temos um gráfico de orçamentado versus  custo real ao longo do tempo ou plano de despesa versus de fundos gastos.

Figura 1
O custo orçamentado é o valor planeado do trabalho do projeto. Novamente, pense em termos de valor ou em termos económicos. Este gráfico mostra que os custos reais do projeto são significativamente menores do que os custos orçamentados. Parece que tudo está bem com o projeto - parecemos estar subestimando. Mas o que essa trama nos informa sobre o trabalho real concluído? Não muito; A percentagem do orçamento gasto ou o custo real não equivalem à percentagem do projeto completo. "A percentagem do gasto não é percentagem do feito". Então, ainda estamos no escuro em relação à situação de status.

Gráfico de Custo e de Valor Ganho

Agora vamos adicionar o valor ganho a essa trama para obter mais informação; o valor ganho contabiliza quer o custo do projeto como a situação de trabalho alcançada para colocar o valor no trabalho realizado. Este custo do projeto e a medição de progresso entregável em termos de euros fornece a valiosa terceira etapa, figura 2, para os lotes de custo orçamentado e custo real.
Figura 2
Quando adicionamos uma percentagem de conclusão em euros ou valor ganho para a nossa trama, observamos que a situação do cronograma real não é boa. O valor obtido a partir de setembro é significativamente menor que o custo orçamentado, então estamos atrasados. E o valor ganho a partir de setembro é menor do que o custo real, então nossa taxa de uso dos fundos do projeto é maior do que a taxa de progressão entregável; Estamos sobre o orçamento no trabalho concluído. O lote de valor gano revelou a verdadeira situação do    projeto, o que não é bom.
O gráfico de exercício mostra o valor em traçar a métrica de valor ganho e os custos em conjunto. Fornece uma visão de cronograma muito melhor e permite que uma análise que de outra forma não seria possível. A intenção aqui não é listar as muitas métricas de medição de valor ganho que ficam disponíveis a partir deste gráfico de três elementos. Essas métricas de gestão do valor ganho estão resumidas no Cartão de Ouro de Gestão de Valor Ganho da Defense Acquisition University.
Por enquanto queremos somente apreciar melhor o valor obtido ao discutir um projeto. No projeto de demonstração, acordou um contrato para construir 4 Quilómetros de via férrea por 400 mil em quatro meses com um contratado. No final de 3 meses, o contratado completou apenas 2 milhas de via com um custo de US $. ~
O gráfico apenas considera os custos orçamentados e reais, então dirá que no final de três meses você está 50.000 € acima do orçamento. Você gastou 350.000 quando foi orçado para gastar apenas 300.000. Mas esta análise apenas considera custos planeados e custos reais. O valor do trabalho alcançado não é considerado. O valor ganho considera o custo e o âmbito do trabalho alcançado em conjunto.
A análise do valor ganho diz que, a cada mês, devem "ganhar" 100 mil se estiverem no alvo por custo e cronograma. Infelizmente, em 3 meses eles apenas completaram 2 milhas de trilhos, pelo que seu valor ganho é de apenas 200.000. Bem, eles gastaram 350.000, então eles estão acima do orçamento em 150.000 e não 50.000. Também só completaram 2 milhas de trilho quando o programado para completar era 3 milhas, então estão atrasados em 100 mil. Esta análise de cronograma é refletida no gráfico de valor obtido para o projeto ferroviário, Figura 3.
Figura 3
A análise deste gráfico mostra uma variância de custo do valor real de ganhos de 150.000, o que é 3 vezes mais a variação de custo quando apenas considerando valores de custo e valor ganho. O planeado para o valor ganho em Euros é de 100.000. Note que o gráfico também exibe convenientemente o valor de tempo dessa variação de cronograma, 1 mês.

Sumário

Quando se trata de medir o progresso do cronograma, é comum considerar o âmbito completo ou os entregáveis submetidos. Se, no entanto, incluímos tanto o custo quanto o âmbito do trabalho alcançado juntos na medida de progresso chegamos ao termo útil no agendamento de valor ganho.
A métrica do valor ganho, novamente, é fundamentalmente uma percentagem de conclusão em Euros. O valor ganho não é simplesmente o dinheiro gasto; É o valor do euro colocado no âmbito completado. Considere-o como o dinheiro obtido pelo âmbito concluído. O subcontratado conclui o trabalho e é compensado monetariamente em conformidade. Essa compensação correlaciona-se com o valor ganho num momento no tempo durante a vida do projeto.

O projeto é, portanto, compartimentado em pedaços de trabalho que têm valor monetário e, se completo, valor ganho. O valor ganho, além do plano de gastos (orçamento) e dos recursos gastos, fornece muita visão sobre a verdadeira situação do projeto.

Sunday, August 27, 2017

Brief Introduction to Earned Value

The key to unlocking the door to a plethora of project status metrics is earned value, which is a way of placing a value on the progress of work achieved. But how is earned value specified?
Much in Earned Value Management (EVM) hinges on the monetized value you place on accomplished work or progress on deliverables.

This article briefly discusses earned value to support more insightful EVM.

Read The article on Tensix

Sunday, July 23, 2017

Primavera P6 and Super Critical Bars

It’s good to note critical activities that cannot delay without negatively impacting schedule completion. But what about activities that are already behind schedule? These are your super critical tasks that require adjustment to meet project completion goals.

The critical path is an important scheduling parameter; it determines the length of your schedule. Activities along the critical path have zero total float, which indicates that they cannot delay without delaying the project completion.

Read the total poson TenSix

Tuesday, March 28, 2017

Activity Codes in Primavera P6 Professional

Read the post on TenSix web site
Once you have all your deliverable Work Breakdowns Structure (WBS) elements and associated activities listed in your schedule, you most likely will receive activity report requests from upper management. Activity codes help filter, group, and sort activities by some particular value, such as project phase, location on work site, and/or responsible contractor for an activity’s completion. Yes activity codes support schedule reporting.
The link is this 

Wednesday, January 11, 2017

How To Find Relationship Lag in Primavera P6

How To Find Relationship Lag in Primavera P6:

....
According to the Practice Standard for Scheduling, a document prepared by scheduling experts at the Project Management Institute, using Relationship leads or lags add significant schedule risk to a project.    The main reason is the lack of visibility of lag delays on project schedules.  Lag time is hard to identify and document – it isn’t obvious when looking at the Gantt Chart or when analyzing a schedule’s dates.   When lag time is used on a schedule, it is very rarely documented why the delay was added,  causing construction managers to scratch their heads.  ....


'via Blog this'

Wednesday, August 3, 2016

S-Curves in Primavera P6 Professional

We’re frequently asked if Primavera P6 Professional is capable of displaying S-Curves. Sure, it can do that. You just have to know where to look.
This article is a ‘How To’ on S-Curves in Primavera P6 Professional, how to configure them and how to print them.

What is an S-Curve?


For those of you who are new to the topic, an S-Curve is a simple graph that plots costs, hours, units or other values (depending on the subject matter) over time. They are popular in Project Management because they give managers a quick and easy-to-understand view of cumulative budget, actual and remaining values over the project lifecycle. The term S-Curve denotes the tendency of the lines to form a shallow ‘S’ shape; flatter at the start, steeper in the middle and flattening off again towards the end. This shape is very typical of most projects as the effort ramps up in the beginning periods, stabilizes during the main execution phase and then starts to wind down again towards the Project’s completion.


Read the remainder of this post on  Ten Six

Wednesday, May 25, 2016

Primavera P6 Four Week Schedule Look Ahead

Once a schedule has been created, baselined and started, you begin the process of tracking progress. In support of this effort, it’s not uncommon to want to report all activities taking place in say, the next 4 weeks.

David Allen’s popular book on organization entitled “Getting Things Done” encourages you to focus on listing the next steps required to keep your project’s progress moving forward. The beauty of Primavera P6 is that it can display everything that commences or is in progress over the next 4 weeks. These are the next step items of your project schedule.

Read the all article on TenSix

Wednesday, April 20, 2016

Organizing Filters by Project Layouts in Primavera P6 Professional

In Primavera P6 Professional there are several different filter types including default, global, and user defined. But did you know there is also a fourth type of filter? This is the layout filter type that can be associated with a specific Layout. This can be used to help better organize your filters.
Read on Ten Six

Wednesday, March 2, 2016

Primavera P6 Professional EVM Features

Increasingly of late, we’ve been getting enquiries about the capabilities of Primavera P6 Professional as far as performing Earned Value Management (EVM) is concerned. Can it do it? If so, can you help us use Primavera P6 for Earned Value Management? Can I develop a DoD or DoE certified EVM system using just Primavera P6?


Read the article on TenSix

Monday, February 15, 2016

Cannot filter on Start or Finish date

You have a very simple project. You want to show only activity which finish on 25-Jan-16.
As usual, you create an filter like this:

Then… SURPRISE. It’s a blank screen.

A big “WHY” question.
To answer this question. You need to show the time of activity by going to Edit -> User Preferences -> Dates tab -> In “Time” section, click on “24 hour”

Now you can see the Time when activity start and finish.

You can notice that when we define the filter, by default the Time is 00:00. That’s why P6 can not find any activity.

So we can change the criteria to cover the whole day like this:


Now P6 can show the activity which has finish date of 25-Jan-16.

Monday, February 1, 2016

Primavera Functions That Project Managers Must Know

Oracle Primavera helps to make your project management responsibilities easier and more efficient. However, understanding all of the tips and tricks in Primavera functions does not necessarily mean that you will be productive.


Instead, you need to know how to perform certain, specific actions and functions, and this list will help you get on your way towards a more successful, productive schedule.
Read the rest here

From Innovative Management Solutions

Monday, April 20, 2015

Measuring Project Progress: 6 Methods You Should Know

By Reshma Sadhu

Accurately measuring the progress of a project is always a challenge. There are many factors to account for in an progress update – type of measurement, accuracy of the data, frequency of the collect and the system of record are all important factor in accurate progress measurements.

And software packages like Primavera P6 don’t always help us out. Sure there a 3 choices for Percent Complete Types, but how to we decide which one works best and under which conditions?

Inaccurate progress will foil your ability to spot early warning signs of trouble ahead, so to avoid that, here are 6 common methods for measuring project progress that will help you best measure performance and work completion. The methods below are summarized from “Project Control: Integrating Cost and Schedule in Construction,” by Wayne Del Pico.


1. Units Completed

The Units Completed lends itself well to tracking tasks that are done repeatedly, where each iteration can easily measured. Usually a task that is done repeatedly tends to take about the same amount of time, resources and effort, so tracking the units completed works well here. A simple example could be installing standard light fixtures. Each fixture takes roughly the same amount of time; if we had 100 fixtures to install then we can simply count the units installed. In this case there’s no subjective experience-based judgement involved.


2. Incremental Milestones

Also known as the ‘steps’ method, the incremental milestones method is predominantly used for cost accounts that involve subtasks that need to be completed in an orderly fashion. An example of this technique is the forming and placing of a concrete foundation wall. Laying the foundation wall on footings, erecting inside wall panels and brace, setting horizontal and vertical rebar in formwork and so forth needs to be done in sequence to complete the task appropriately.

So how do you calculate this data? The calculation is built on each single item step and the budgeted amount of time (labor hours) that is needed to complete the task by the construction crew. As each step is completed, that is documented as a mini-milestone which represents a percentage of the total installation process. The percentage given for each subtask can vary based on the project and this progress is usually agreed on to be used as a measuring took beforehand. A good way to implement this method in Primavera P6 is using Activity Steps.


3. Start/Finish

This method is only focused on capturing the starting point and the finishing point of the task and nothing in between. This method is best for tasks that are short in duration. You would implement this method if the task’s work estimations are not available or if the percent complete progress data is too difficult to collect.

“Classic examples include testing services such as load test on electric panels, flushing and cleaning of piping, and similar tasks.”1

Using the Start/Finish technique, we earn a percentage of progress when the task starts and the other half is earned once the task is complete. These percentages are determined by the owner and contractor of the project.

Often, companies agree to use the standard 50/50 Rule or other rules:

50/50 Rule – once started, the task is marked as 50% complete, and the balance is earned at final completion of the work.

20/80 Rule – used to track higher value tasks that takes a longer time to reach completion.

0/100 Rule – this rule illustrates that once 100 percent of the task is completed, only then will the value be earned. An example of this is in testing or experimental tasks since you cannot get results until the task is completed.


4. Cost Ratio

The Cost Ratio method is usually implemented on a project that has tasks that tend occur over a long phase or the entire project. Often used for Overhead costs, this technique is measured based on the budgeted allocation of dollars vs. the labour hours of production. This method gives the contractor the ability to earn value that is equal to the overall percent of project completion.

“For example,[] if the overall progress of the project was determined to be 42 percent, then the contractor would have earned 42 percent of the overhead and fees.”1


5. Experience/Opinion

Unlike the methods above that rely on definitive data, this method is relies on the experience and subjectivity of the project manager. This technique is used for tasks such as dewatering or frost removal/protection. It’s not usually recommended and tends to be seen as the last resort because each individual’s experiences and opinions vary from one another and can cause conflict between owners, contractors and architect.
 

6. Weighted or Equivalent Units

This method was highlighted as the best technique in the text and is the one that requires more effort, but also extends to a wider data range. The tasks that are being calculated tend to occur over a longer duration time and includes multiple subtasks, where subtasks can have different units of measurements.

The example used to illustrate this method is building a structural steel package. In order to complete this project it requires various units, labor hours, resources and subtasks. So to calculate the subtasks, it’s weighted on the estimated level of efforts in labor hours or by monetary value that is particular to each subtask. Once the weighted value is determined, it’s converted to reflect that value in units of measure specific to the task – and for this example, the units of measure would be tons. So once each subtask has been completed, the weighted tons (units of measure) is then converted to the equivalent units of percentage complete of the overall project.

These 6 methods for measuring project progress are commonly used in Construction project management and filter into a process of determining a percentage complete for the project as a whole using Earned Value Management.

Which of these methods do you the most on your projects?

Wednesday, March 25, 2015

Is Retained Logic the best Scheduling Option in Primavera?

Primavera has three Scheduling Options to choose from when you are scheduling your project. Retained Logic is the default scheduling option. When you are building a Baseline, the default option works fine. But things change when you start updating your project, activities start getting delayed and do not get executed as planned.  You then have to make a decision on whether you want to continue using Retained logic or choose Progress Override or Actual Dates as your Scheduling Option. A lot has been discussed over the internet forums on which option is the best for a project and Retained Logic has won with an overwhelming majority. But I have a different opinion.

image

Read the blog here

From Amit Parmar em www.theprimaverablog.com

Wednesday, February 25, 2015

Tracking Costs in Primavera P6

Do you know how to track schedule costs in Primavera P6? Most of us are familiar with the process of updating and tracking schedule activity progress from a time standpoint, but what about the cost of those activities? Well, Primavera P6 has features available for keeping track of the cost of labor, equipment, and material resources. It is also possible to track the cost of project specific expenses.

This article describes the process of tracking the cost of labor resources on a project. It considers a schedule where all activities are on the critical path, so a delay in any activity will result both an increased activity cost and project management cost.

See the rest of the post in Tensix Blog here

Friday, May 9, 2014

Why EPC Contracts are bound to be delayed

As the most common form of Contract for an industrial facility is an EPC Contract, we refer to EPC contractors, isn’it?

This is a little misleading I believe… and offers an opportunity to unveil what I believe to be a systemic cause to EPC Project delays.

One could imagine an EPC contractor to be a company covering the whole range of activities for the execution of a Project, from the drawing board to the pipe erection at Site.

Such integrated model existed, up to the eighties, but has disappeared, Engineering companies having first cut their construction labour and equipment then their construction supervision.

The EPC Contractor one will find today is typically an association of two companies, one doing Engineering and Procurement (E&P) and the other one the Construction (C).

There are 3 types of associations between these two companies: a JV, a consortium or a sub-contract. The most frequent is the last one, the Construction contractor being sub-contractor to the Engineering Company, to which is awarded the EPC Contract.

Let’s look at the pro’s and con’s of each type of association to understand the paradigm leading to systemic delays in EPC contracts execution:

The Joint Venture seems the ideal: both parties share a common profit or loss. There is no conflict of interests.

The issue lies with how one party controls the costs charged by the other party. It is very difficult for an Engineering Company to control the manhours of manpower and equipment charged by a Construction contractor. The Construction contractor is likely to inflate the latter to make its own profit on these charges, regardless of the profit it could get from the JV.

The consortium has each party responsible for its scope, expenses and profit. This provides an incentive for each party to minimize its costs. There is a non recourse clause in the consortium agreement that prevents one party to claim to the other.

The issue lies with the impact that could be suffered by the Construction partner due to the delays in drawings and materials deliveries from the Engineering company. These delays will typically result in idle manpower and equipment. The Construction contractor will not be able to claim the resulting extra cost from the Engineering company. Knowing this, it will include such costs in its bid which will affect the price competitiveness of the consortium bid.

Finally, the most commonly found type of association is the sub-contract. The Engineering company sub-contracts construction activities to a construction sub-contractor.

The construction contractor is commonly paid applying unit rates to installed quantities, e.g. so much for a cubic meter of concrete cast, so much for a ton of pipe erected etc. This means that the construction contractor will be paid a fixed amount for a given amount of work done whatever its actual consumption of resources (manpower, equipment) is. In other words, the construction contractor bears its productivity risks.

The productivity of the sub-contractor is however highly dependent on timely deliveries of drawings and materials by the Engineering company. In case drawings and material deliveries are delayed, idle time of manpower and equipment will be suffered by sub-contractor, as sub-contractor will still be paid the same amount for each erected ton of steel and the manpower and equipment will require to be mobilized over a longer period.

In theory the sub-contractor could claim for such extension of time and related costs. Such claims are indeed made possible by the sub-contract type of association, contrary to the consortium.

In practice, the sub-contract usually contains difficult to match conditions to such claims. The claim might, for instance, be eligible only of there is a proven overall – not local – lack of workfront. The sub-contractor might also be required to prove that the delay impacts the schedule critical path etc.

As engineering and material deliveries are always subject to out-of-sequence and delayed deliveries, and the above claims are difficult to make, the sub-contractor will be careful not to mobilize too early. The sub-contractor will rather aim to always be a little under mobilized to achieve the best productivity.

On the other hand, the EPC contractor will not be fully transparent with expected engineering and material delivery slippage as its interest is construction progress rather than productivity.

Here, I believe, lies the systemic factor that leads to delays of EPC Projects organized under such contractual schemes.

As such scheme is the norm, one deducts that the owner is more concerned with price than schedule and has accounted float in its overall schedule for delay in the execution of the EPC Contract.

The scheme still entices the EPC contractor to complete as early as possible to avoid both Liquidated Damages and extra costs of prolonged presence at Site.

Friday, March 7, 2014

Primavera P6 Excel Import Problems

Many P6 users have trouble importing data from Excel. Many of the problems are focused on importing costs or other numeric data fields that have been manually typed into Excel.
 

Why can’t I import Primavera P6 cost data from Excel?

Primavera P6 only imports data that is formatted as “Text” in Excel. If you have manually typed in a value like “$32000″ into an Excel cell, Excel will auto-format that field as “Currency”. Then on re-import, P6 will not accept the data, as it needs to be “Text”.

Setting Excel’s Format Type Doesn’t Work

If you try to set a cost cell or a number cell to Excel’s “Text” format type, P6 will still not import it. Why?

You Need The Apostrophe ( ‘ ) !

P6 won’t import the field unless it has a leading apostrophe. The apostrophe is a legacy indicator that a field is textual and P6 looks for it. It your cell’s data does not have the leading apostrophe, P6 won’t import the data in that cell.
 

Ok, I have the Apostrophe, and I still can’t import Costs into P6!

As our good friend Zoltan Palffy has pointed out, to import costs from Excel, you’ll need to ensure that P6 is not calculating costs for you. On the resource tab, you can add a column called “Calculate Costs from Units”, which is a checkbox field you can check on or off. If your resource assignment has “Calculate Costs from Units” checked ON, then you won’t be able to specify a cost, and thus import costs from Excel. Make sure this field is checked off before you try to import.

To turn that setting off for all resource assignments, build a Global Change, that sets “Calculate Costs from Units” to No.

The Apostrophe is still important.

from Planner Tuts

Tuesday, March 4, 2014

Project risk and issue reporting

Reporting on project risk and isssues is a matter that changes in every project and for specific client. There is no method and format known for this kind of reporting, but erverybody concurs that including it on the status report will be an inprovement for the decision taking activities.


Are there guidelines about what risk information should be reported to senior management?

No, not that I am aware of. The PMI Risk Practice Standard doesn’t include anything. The PMBOK® Guide talks about ‘Project Performance Reports’ but provides no detail as to what these should include. I think you’ll have to define the content of your reports yourself.

 
What should you include in a graphical risk management dashboard?

For a senior management report I would only report the open risks per project and/or open risks per category (scope, budget, schedule etc). This would let you see if there is one area like schedule that has a big risk impact on all projects.

I wouldn’t include:

  • Total number of risks overall
  • Closed risks
  • Risks with an impact status of Low or Medium

This is because the senior management team can’t do much, if anything, with this information. The number of risks alone is pretty meaningless. Some may be very small, some projects may only have a few but they could be significant. A better way would be to report risk impact – what is the cost of all the risks if they happened?

The best approach would be to ask the key stakeholders what they are interested in seeing. I don’t think closed risks or number of risks is of any use as it doesn’t give them information they need to make decisions about the project. Risks by category, or risks with an impact rating of ‘High’ is more meaningful.


Should I show risk trends over the months?

No. What would the senior management team do with this information? At the beginning of the project you’ll identify lots of risks and then close some and open new ones. If you have a risk review meeting one month and identify another 50 risks this will skew the trend data. I would advise only showing a snapshot in time. You could use an arrow to indicate whether the overall risk profile of this project is going up or down, using a metric like whether there are more or less High risks or whether the cost implications for risk mitigation are going up or down.

 
What about reporting on issues?

For senior management, only show the high priority open ones. Typically I report also on ‘high priority closed this month’, then those issues drop off the report for the next month. This shows that you are making progress in resolving issues, even if new ones come along. If you don’t do this, your report could show that there are 20 open issues with a status of High Priority this month, and 20 next month. However, they could be 20 completely different issues! Without more detail, like issue names and descriptions (which, frankly, your sponsor is not going to want to wade through), your stakeholders will not know that you are dealing with issues and may assume that you are not tackling problems on the project.

As well as a graphical representation in a pie chart or dashboard, I would also include the top 10 issues in more detail – descriptions and action plans. If you need senior management input to resolve any issues make sure that these are included in the report and that you highlight where they need to make decisions.

Again, the best approach would be to ask your senior management team what they want to see. If they don’t know, present them with your graphs and report for a few months and then ask for feedback about what they think and what else they need to know in order to carry out their roles on the project i.e. decision making, governance and oversight.

Tuesday, November 19, 2013

Variance Reporting in Primavera P6 Professional

Variance Overview

Variance reporting in Primavera P6 requires that the project has a baseline and it is assigned as either a Project Baseline or a Primary Baseline.

Before attempting variance reporting, you should check the baseline being used for the project. To do this take a look at the information bar at the bottom of the Primavera P6 window.

Baselines are assigned using the Project | Assign Baselines… menu option. The resulting dialog allows existing baselines to be assigned as a Project Baseline or Primary, Secondary or Tertiary baseline.

With a baseline in place it is possible to report any activity that has moved away from its baseline date in the current project schedule.

Variance Reports are typically created using filters that look for values other than zero in the Variance fields available in P6.

You can see the available variance fields using the Columns dialog in P6 as shown in the following figure:

Variance Fields Prefix Explanation

Fields prefixed with Variance – BL Project contain variance values based upon the baseline project assigned as a Project Baseline.

Fields prefixed with Variance – BL1 contain variance values based upon the baseline assigned as the Primary Project.

Fields prefixed with Variance – BL2 and Variance – BL3 contain values based upon the secondary and tertiary baseline assignments for the project respectively.

Therefore, if you want to find out how the current project is performing compared to the Project Baseline, you would look for non-zero values in the Variance – BL Project fields.

Common Variance Filter Options

To find out which activities are no longer scheduled to start or finish on their original baseline dates according to the baseline assigned as Project Baseline, you would create the following filter using the Filter dialog:

If an activity has slipped from its baseline start or baseline finish date, the Variance – BL Project Start Date and Variance – BL Project Finish Datefields will contain a value other than zero and the activity will be displayed in the Gantt chart.

If the Bars dialog is configured to show the Project Baseline bars, you will see the slippage visually on the schedule. You can also display the Variance – BL Project fields you’re filtering on in the activity table to see by what amount the activities vary from the baseline.

More Variance Filter Examples

Exclude Completed Activities

The following filter will show all activities that have a variance and do not have an Activity Status of Completed.

Only Show Activities Starting Late

In this example the filter has been changed to only show values of less than zero variance. In other words, the variance is negative which will only show activities that will start late. If the activity is starting earlier than the baseline, it will not appear in the Gantt chart using this filter.

Once the Gantt chart is displaying the required fields and activity data, the File | Print Preview menu option can be used to run a variance report.

Note: Filters can be saved with the named layout and will be activated whenever the layout is opened.

From Ten Six